Storyboard: Climate models
Simulating the complex polar climate system
Climate models simulate the Earth's climate system by solving mathematical equations that represent the interactions of atmosphere, ocean, land, and ice over time.
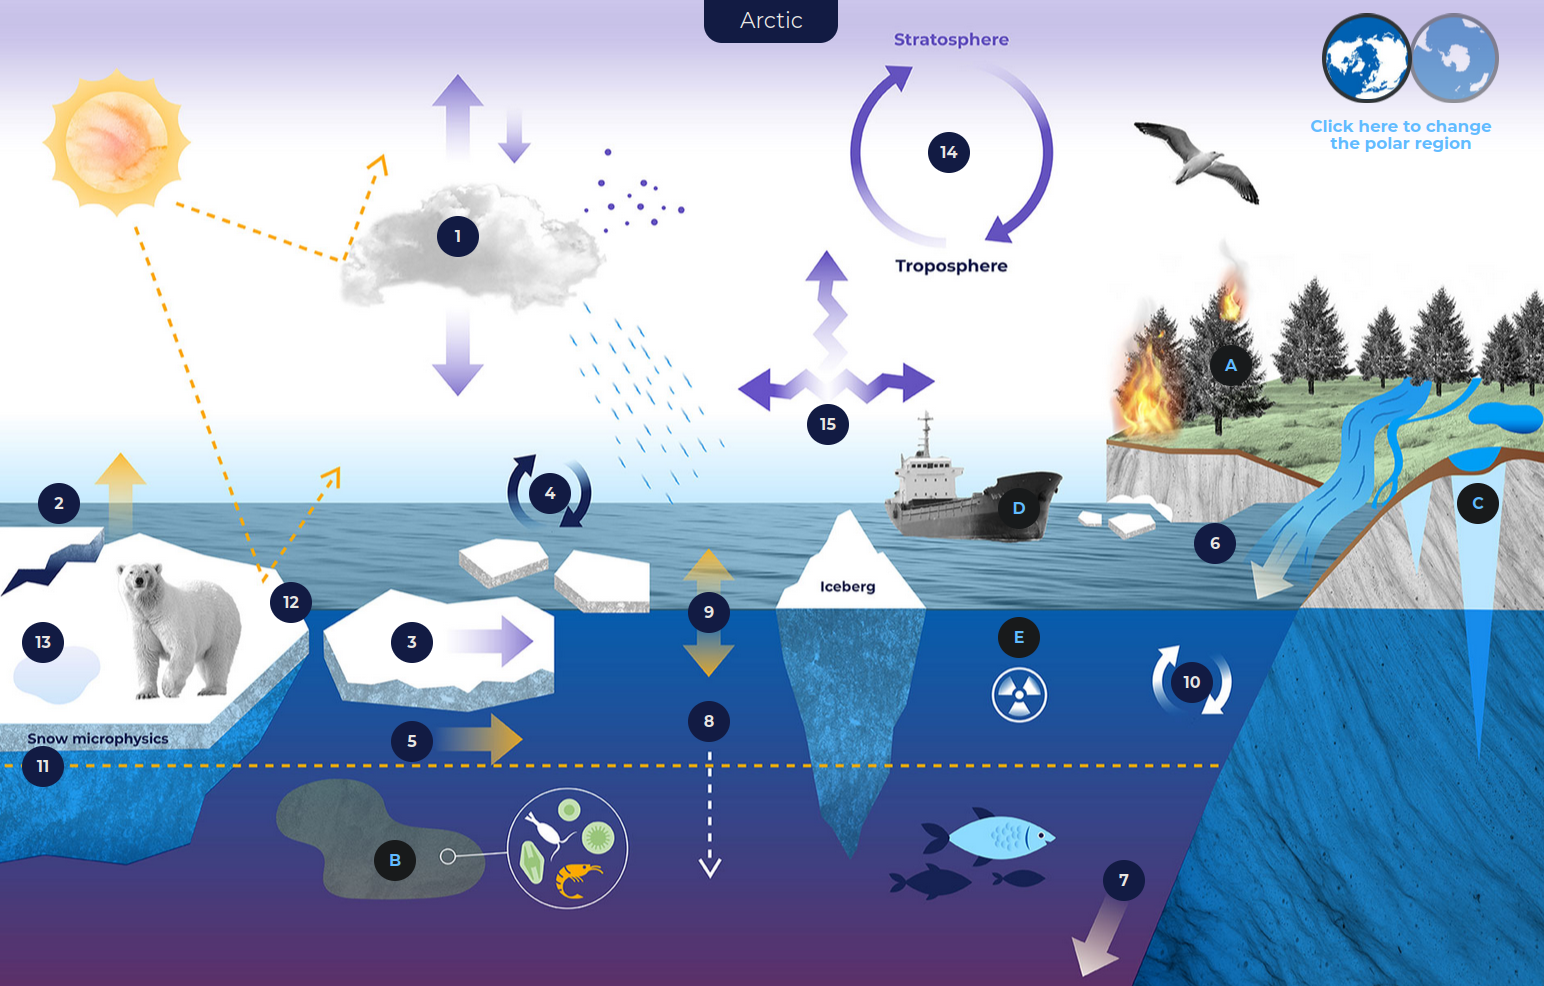
In PolarRES, different model simulations are used to provide improved information on present and future climate change and its impacts in the polar regions. You can learn more about the processes studied in the Arctic and Antarctic in the Polar (change) explorer.
This storyboard gives an overview of the global and regional climate modeling methods used in PolarRES.
For more information on editing stories, see this blog post.
Why model resolution matters?
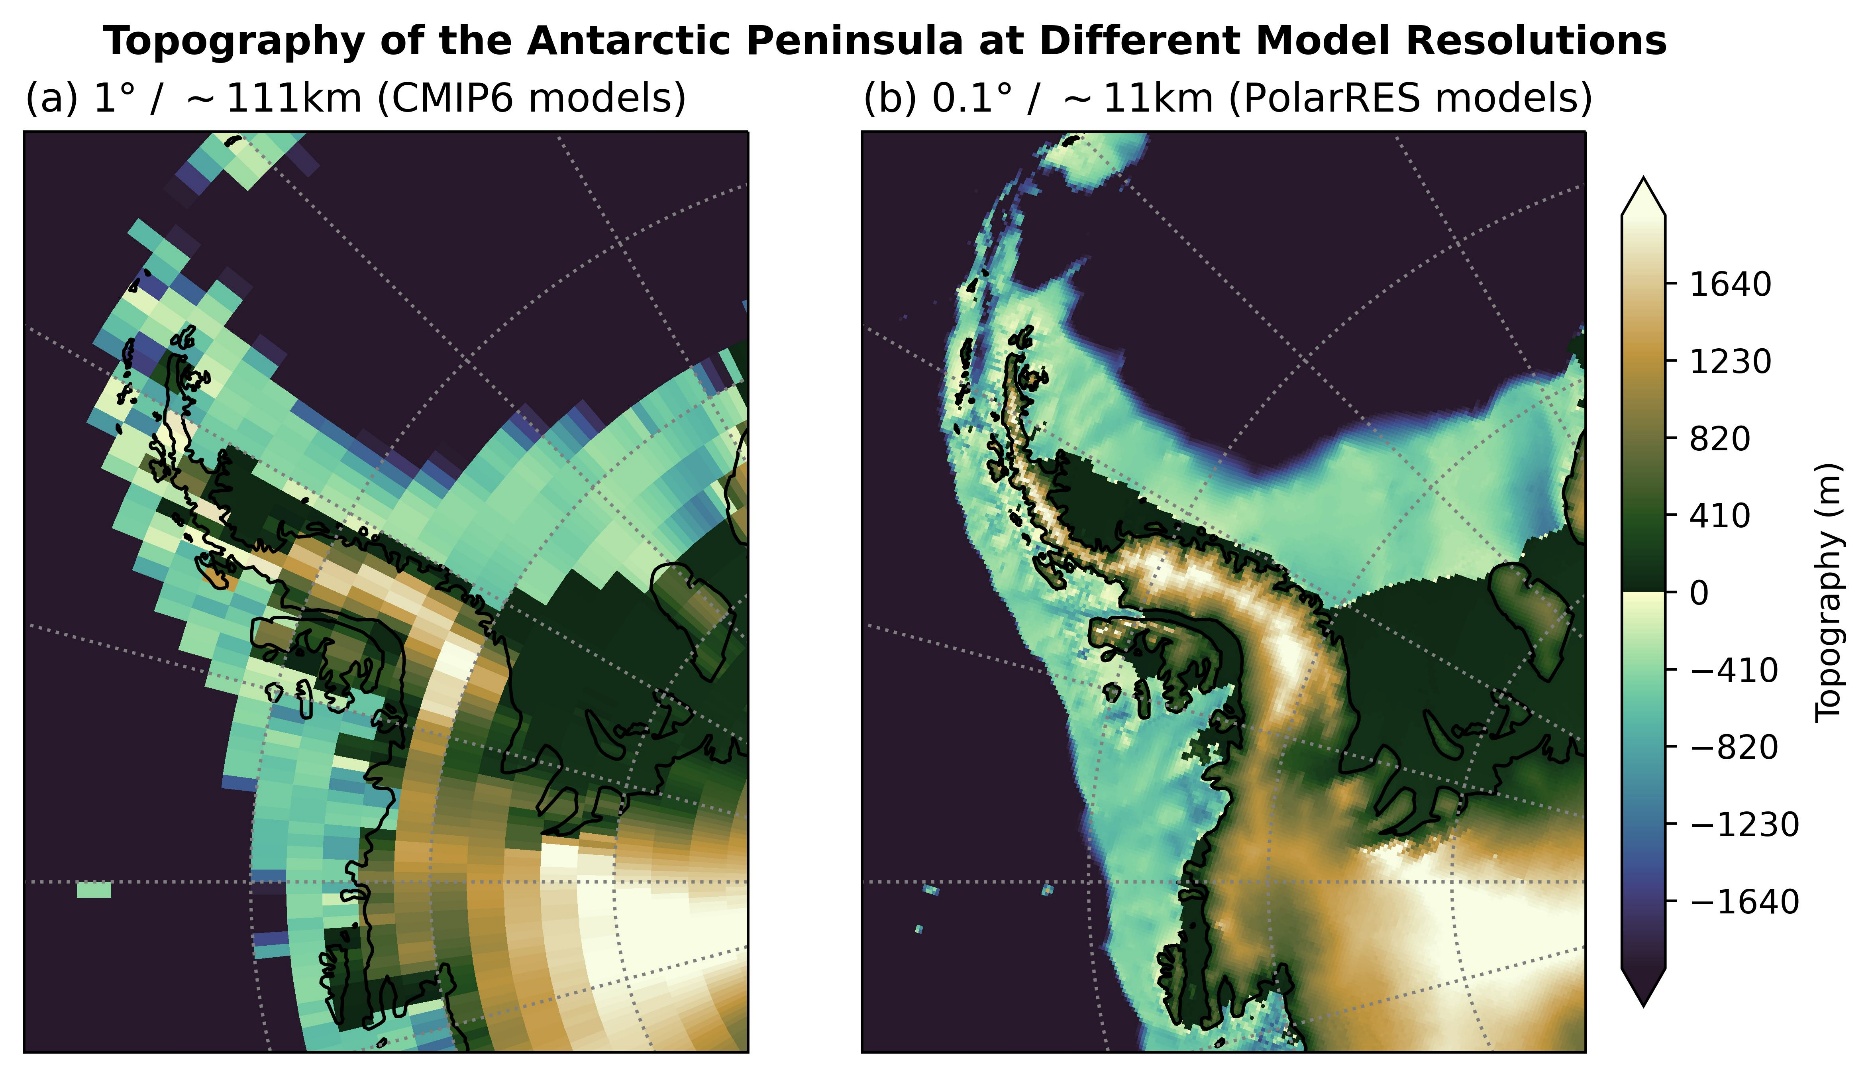
High-resolution climate models are computationally demanding, but they offer a much more realistic representation of key polar climate processes. Simulations with finer resolution can capture smaller-scale features such as coastal dynamics, wind patterns over mountains, ice sheet interactions, and extreme weather events. Most climate projections (CMIP6) rely on coarse-resolution global models, which can overlook important regional details. As shown in the figure above for the Antarctic Peninsula, higher resolution improves the representation of small-scale orography, leading to more accurate simulations.
For understanding and adapting to local climate change — such as permafrost thaw, glacial melt, changing marine ecosystems, or increasing wildfire risks — high-resolution models are essential. They provide more reliable insights into extreme events and local impacts, equipping communities and policymakers with the information they need to prepare for a changing climate.
For more information on editing stories, see this blog post.
What do we use global models for within PolarRES?
Running high-resolution global climate models is extremely computationally demanding. Traditionally, the solution has been to use regional models that focus on specific areas of interest at high resolution. However, in recent years, the development of variable-resolution models has provided an exciting alternative.
By using global models with high resolution in polar regions and coarser resolution elsewhere, we can combine the best of both worlds — capturing fine-scale polar climate processes while keeping computational costs manageable. In PolarRES, for the first time, we run three different variable-resolution models with increased resolution over polar regions. By comparing these simulations to their globally coarse-resolution counterparts, we can isolate and investigate the impact of higher polar resolution. At the same time, we can assess how changes in the polar regions influence mid- and lower latitudes, helping us better understand global climate interactions.
For more information on editing stories, see this blog post.
Global climate simulations within PolarRES?
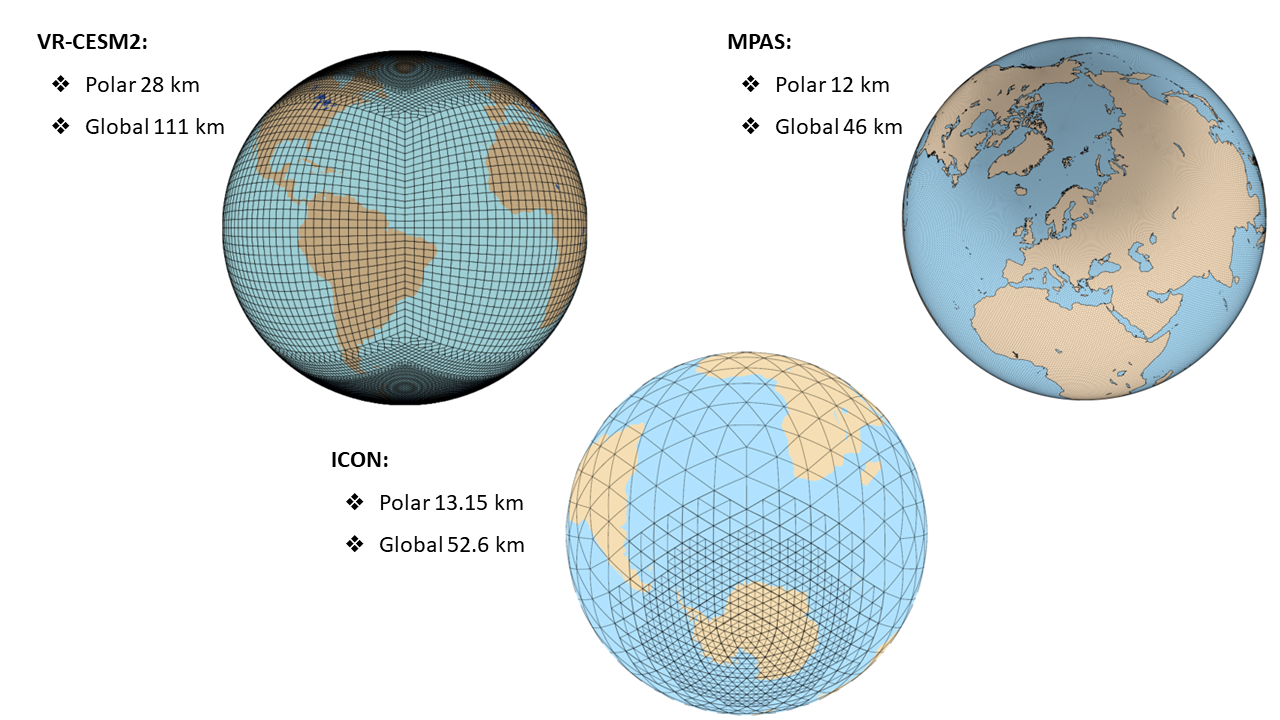
In PolarRES, we run simulations for our present-day climate and future climate scenarios with three different state-of-the-art variable-resolution atmosphere models. By identifying common signals across these models, we can better understand the impact of refined polar resolution on local, regional, and global climate.
The three models used in PolarRES are:
- Model for Prediction Across Scales (MPAS) – run at NORCE, Bergen
- ICOsahedral Nonhydrostatic model (ICON) – run at Alfred Wegener Institute, Potsdam
- Variable-Resolution Community Earth System Model (VR-CESM) – run at Utrecht University
These models allow us to study polar climate processes in unprecedented detail while assessing their influence on the broader climate system.
For more information on editing stories, see this blog post.
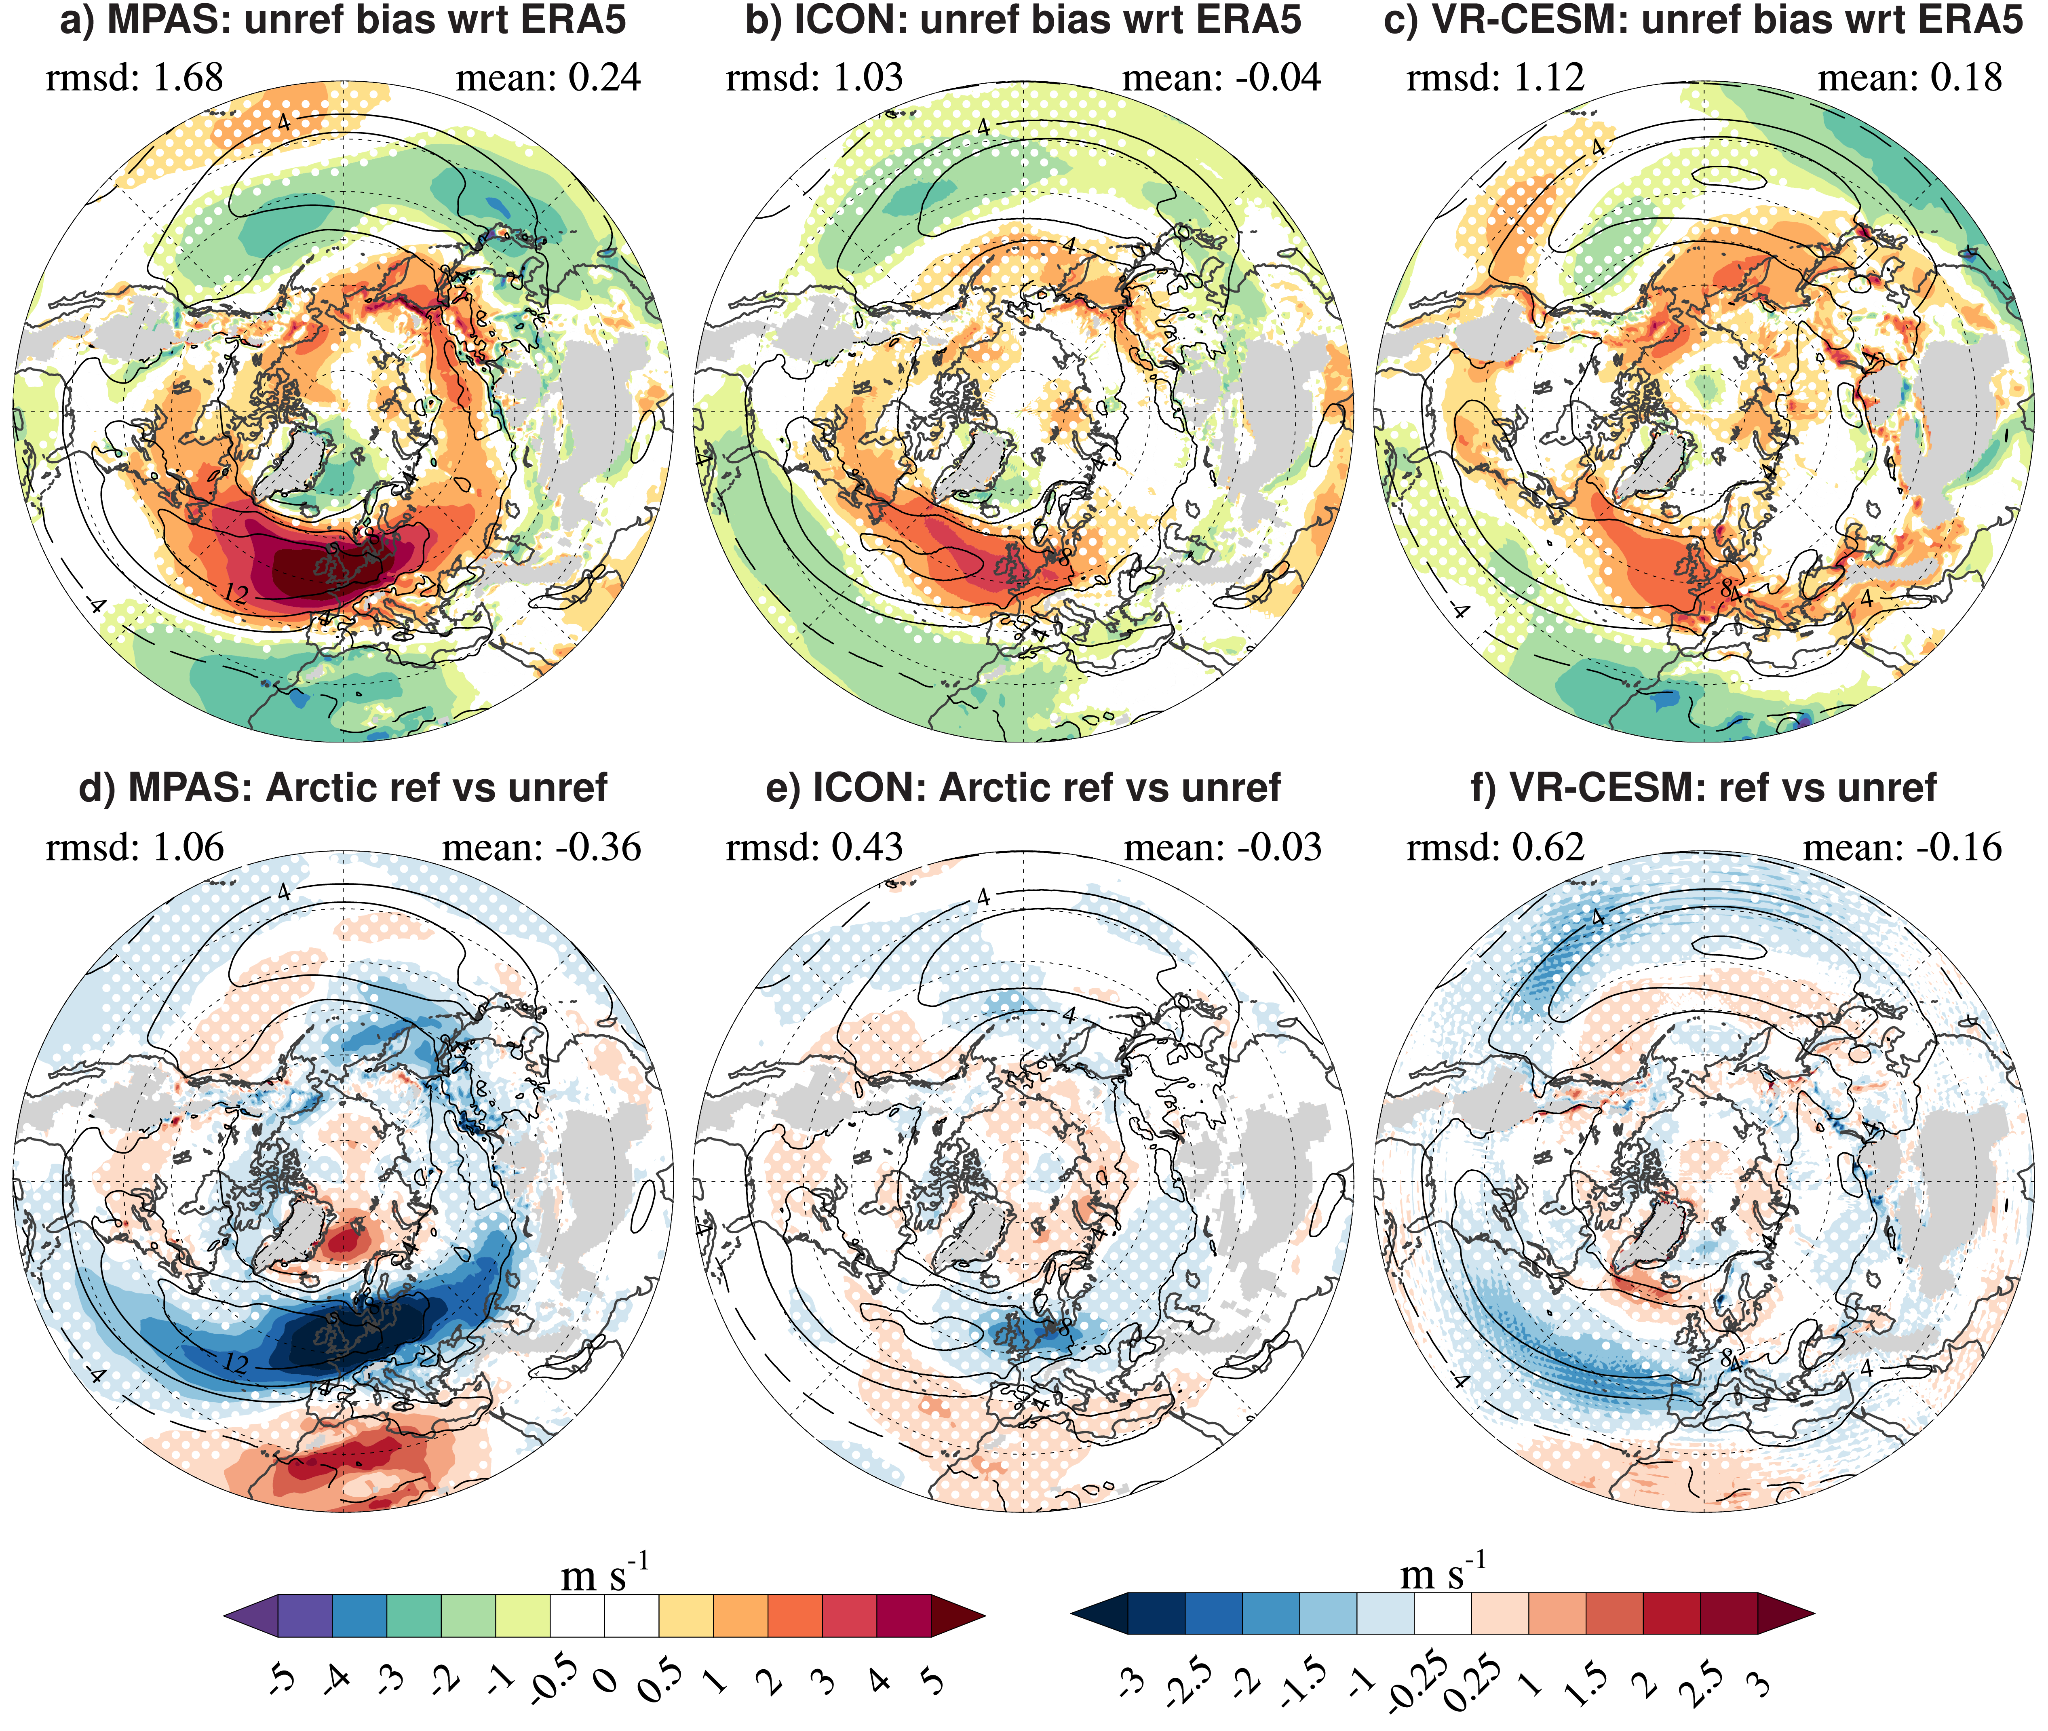
Higher Arctic resolution can improve the representation of the North Atlantic jet stream
The North Atlantic jet stream plays a key role in shaping European weather. In winter, a strong jet stream often brings wet and mild conditions to central Europe, while a weaker jet stream is typically associated with drier and colder weather.
Our three global models tend to overestimate the strength of the jet stream in winter. However, by increasing the resolution over the Arctic using the variable-resolution capabilities of these models, we can achieve a more realistic representation of this crucial wind band.
In our ongoing research, we are investigating how these improvements are linked to changes in the stratospheric circulation. The stratosphere is the layer of the atmosphere above the troposphere (where most weather occurs) and plays a vital role in regulating jet stream variability in winter.
For more information on editing stories, see this blog post.
What do we use regional models for within PolarRES?
The current generation of global climate models (CMIP6) typically operates at a resolution of around 100 km, which is often too coarse to capture local climate processes in detail. To provide more localised climate change projections, regional downscaling is used. This is essential for assessing climate impacts and supporting adaptation and mitigation strategies.
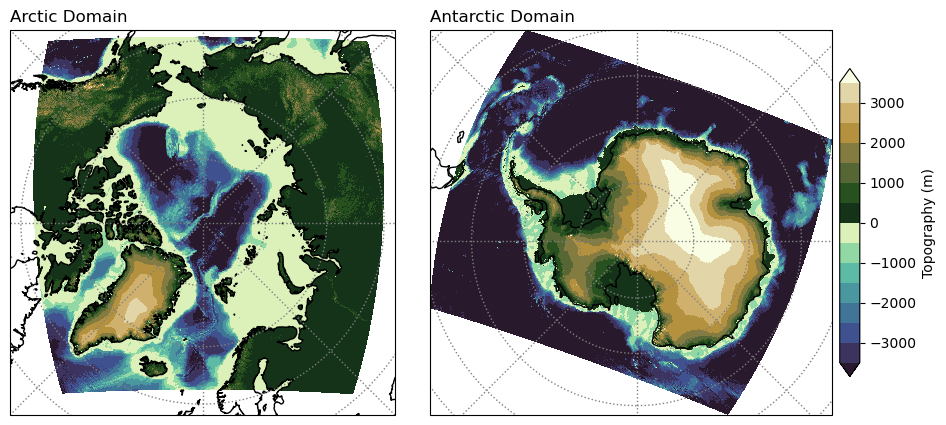
Regional climate projections for different parts of the world are produced within the CORDEX framework, which coordinates high-resolution simulations using regional climate models (RCMs). These models are run over limited areas and require boundary conditions from global models to simulate finer-scale climate processes.
The figure illustrates the Arctic and Antarctic model domains used in PolarRES, where simulations are conducted at 0.1° (~11 km) resolution. This higher resolution allows for a more detailed representation of regional climate dynamics, improving our understanding of polar climate change and its global connections
For more information on editing stories, see this blog post.
Regional Climate Simulations in PolarRES
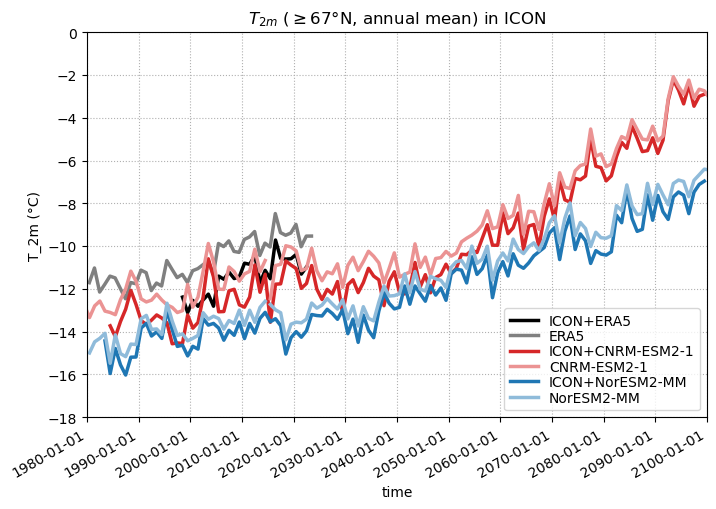
To provide detailed climate projections, regional models require boundary conditions from global climate models (GCMs). In PolarRES, we use simulations from two pairs of CMIP6 GCMs, selected to represent contrasting climate storylines — or possible future pathways. For the Arctic, these are CNRM-ESM2-1 and NorESM2-MM, while for the Antarctic, we use MPI-ESM1-2-LR and CESM2-WACCM.
These models were chosen to capture the range of potential future climate changes within CMIP6 projections. To assess the accuracy of regional models, we also simulate the recent past using boundary conditions from the ERA5 reanalysis, a high-quality observational dataset.
Within PolarRES, several state-of-the-art regional climate models are used to run high-resolution simulations:
- HCLIM – MetNo & DMI (also coupled with NEMO ocean)
- ICON – AWI
- MAR – Liège University (also coupled with NEMO ocean)
- MetUM – BAS
- RACMO – Utrecht University
- WRF – NORCE
The figure illustrates present and future temperatures within the Arctic Circle, as simulated by the regional ICON model. These high-resolution simulations are crucial for understanding local climate change impacts, improving adaptation strategies, and informing policymakers.
For more information on editing stories, see this blog post.
Tracking Warm and Moist Air Intrusions in Polar Regions
One of many applications of PolarRES regional climate model information are warm and moist air intrusions (WAIs) also known as atmospheric rivers, which often cause warm extreme events in the polar regions.
Thanks to the high spatial and temporal resolution of PolarRES data, we can develop new approaches to track WAIs and study their effects in unprecedented detail.
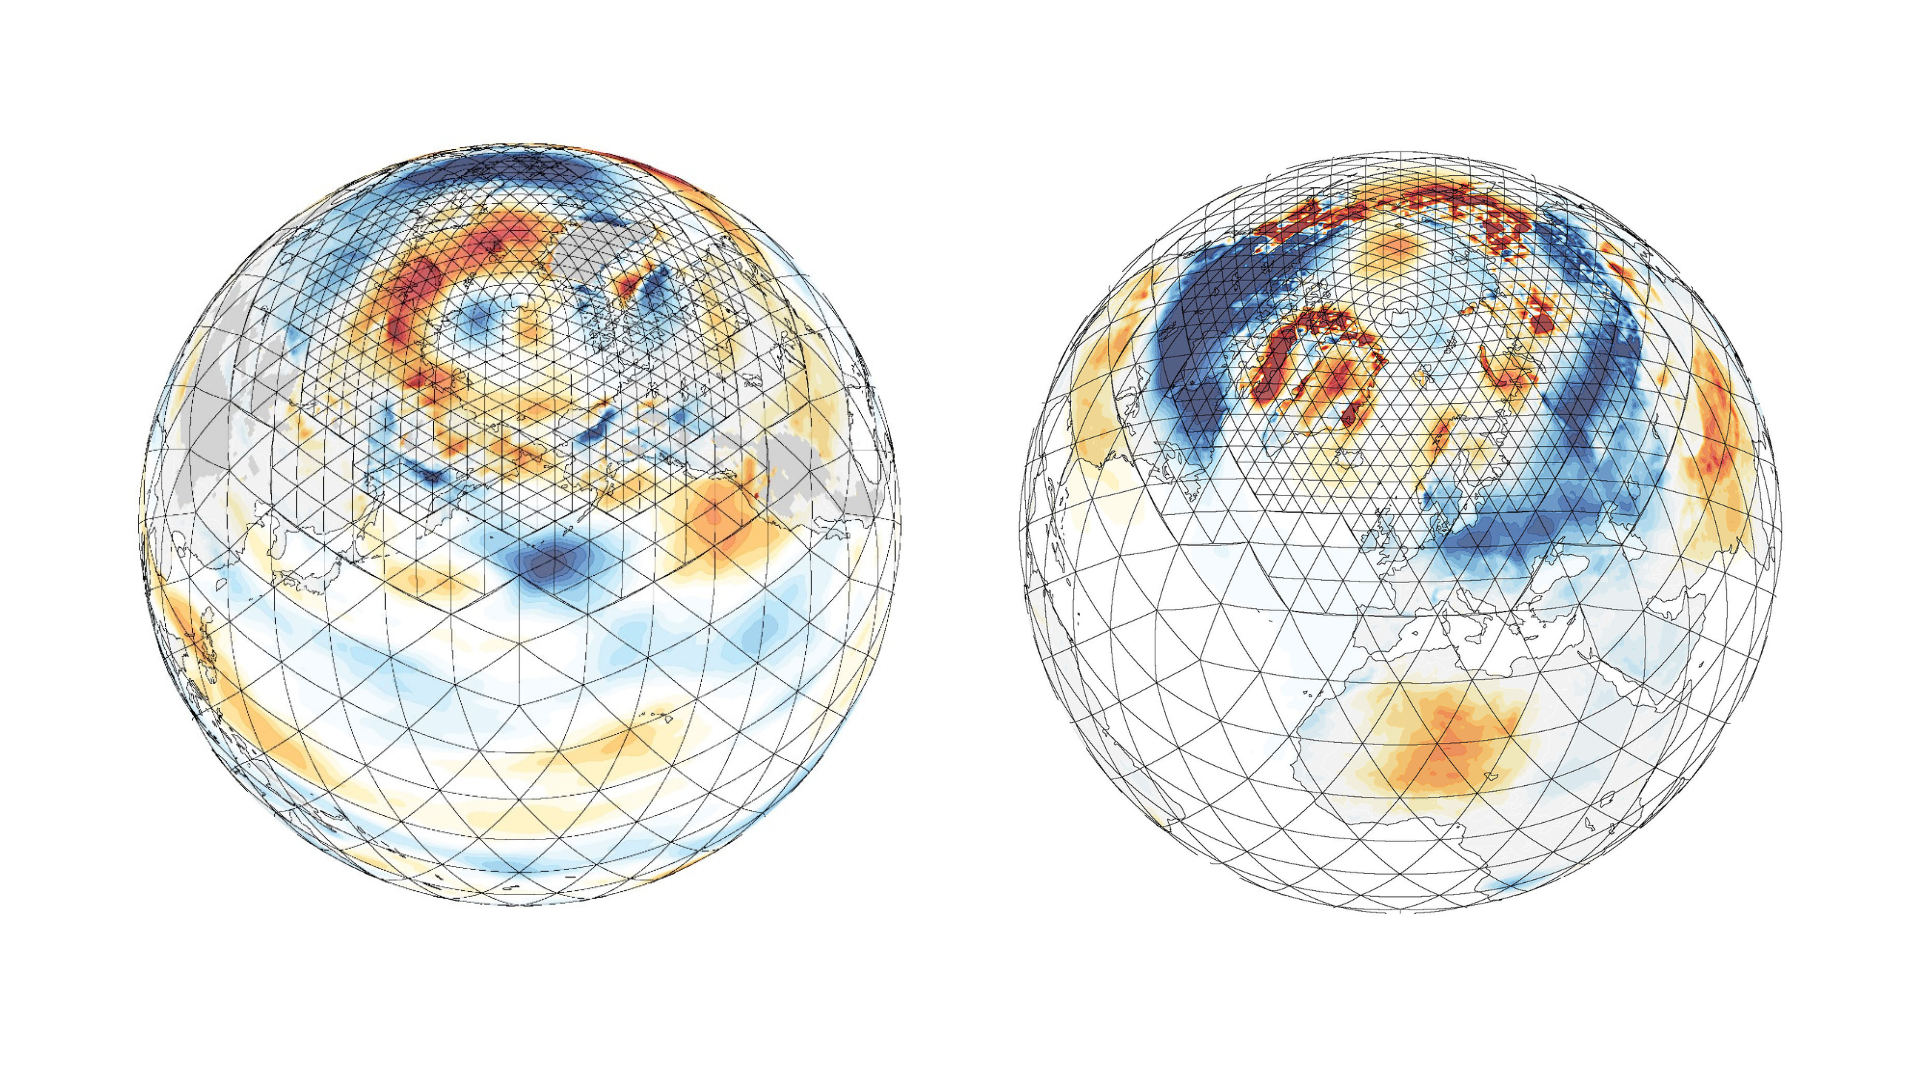
The animation illustrates two WAI events in mid-April 2020, observed during the MOSAiC expedition (marked by the red cross). The two panels show the same results from two of the PolarRES regional models (ICON and MetUM). By using a coordinated model ensemble, PolarRES enables us to assess such extreme events with multiple models, helping us understand model uncertainties and the effects of different representations of key atmospheric processes, such as cloud formation.
For more information on editing stories, see this blog post.
Where do we run our models?
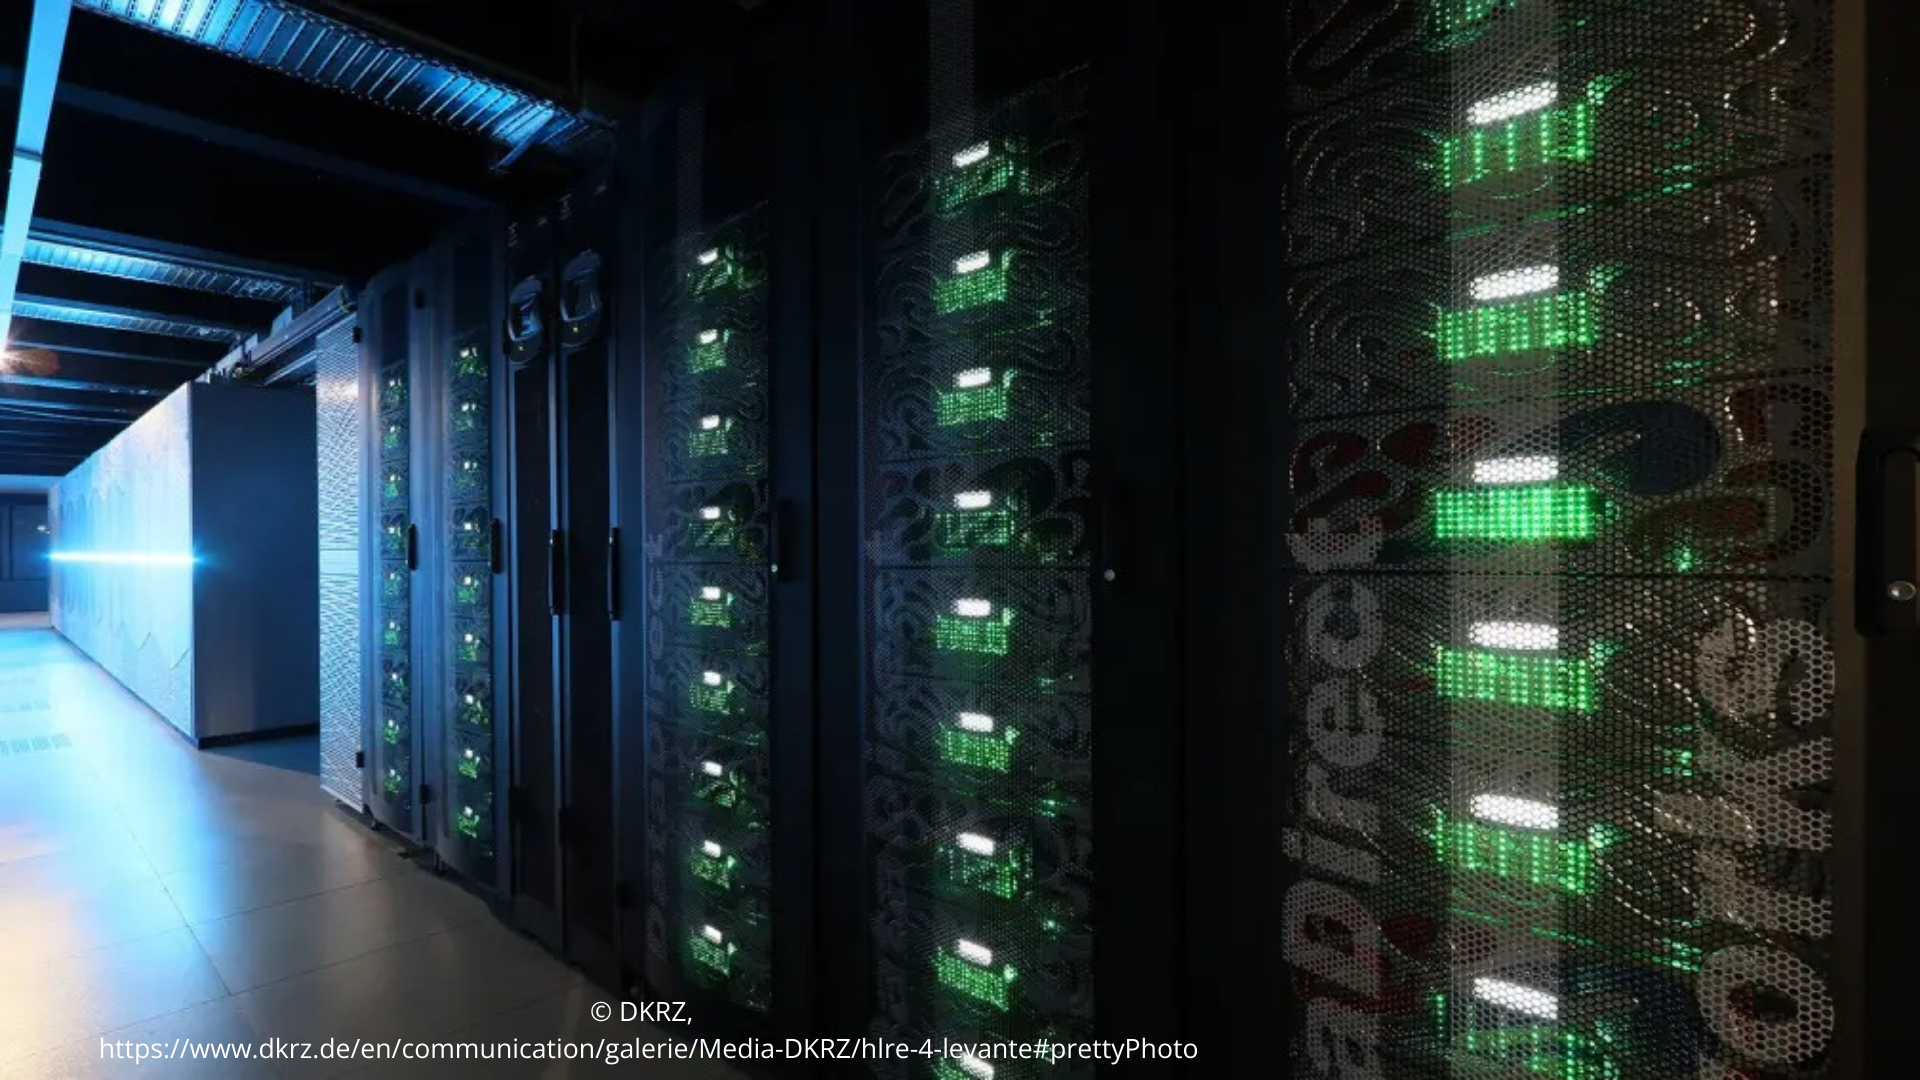
Climate models are based on a highly complex set of equations and parameterisations designed to realistically simulate the Earth’s climate. Solving these equations requires immense computational power — far beyond what a standard laptop can handle. In fact, simulating just one day of climate on a personal computer could take a month, whereas a supercomputer can complete the same task in just a few minutes.
Supercomputers such as Levante at the German Climate Computing Centre (DKRZ) (see image) allow us to run our high-resolution climate simulations efficiently by solving equations for every single grid point at incredible speeds. However, setting up a large ensemble of high-resolution climate models — like in PolarRES — is only possible by combining the power of multiple supercomputers across different research institutions. This collaboration enables us to explore the effects of polar climate changes in unprecedented detail.
The PolarRES project has generated over one petabyte of data — that’s more than one million gigabytes! This massive dataset helps us analyse complex climate interactions and improve our understanding of polar and global climate dynamics.
For more information on editing stories, see this blog post.