Storyboard: Results: fire probability historic
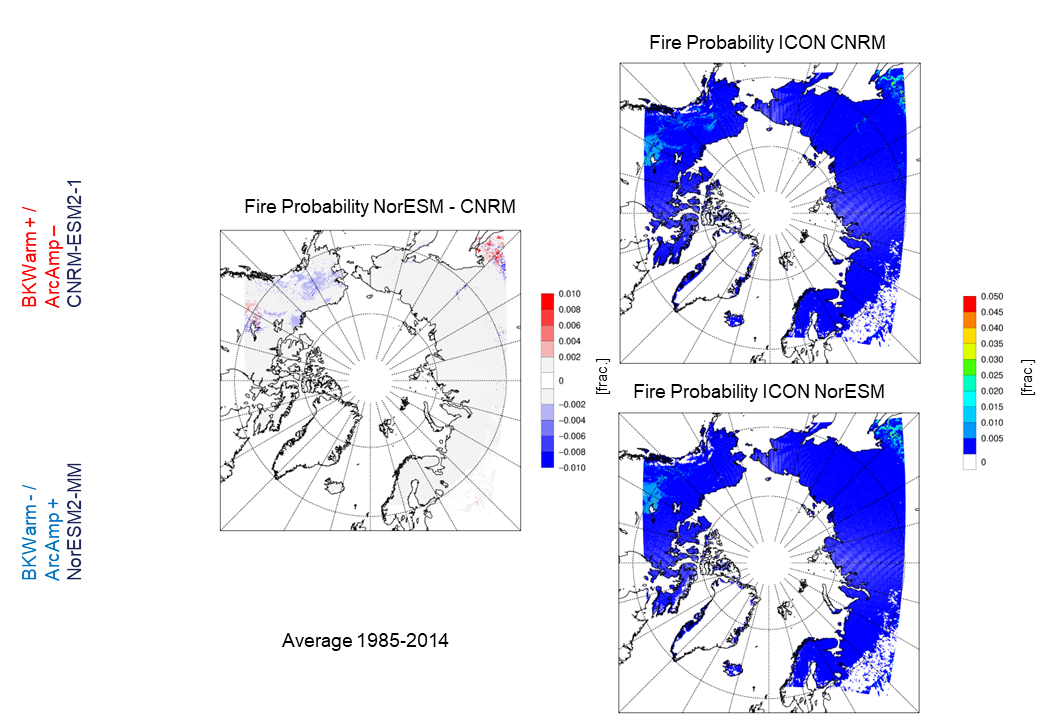
Fire probability comparison between models (1985–2014)
For more information on editing stories, see this blog post.
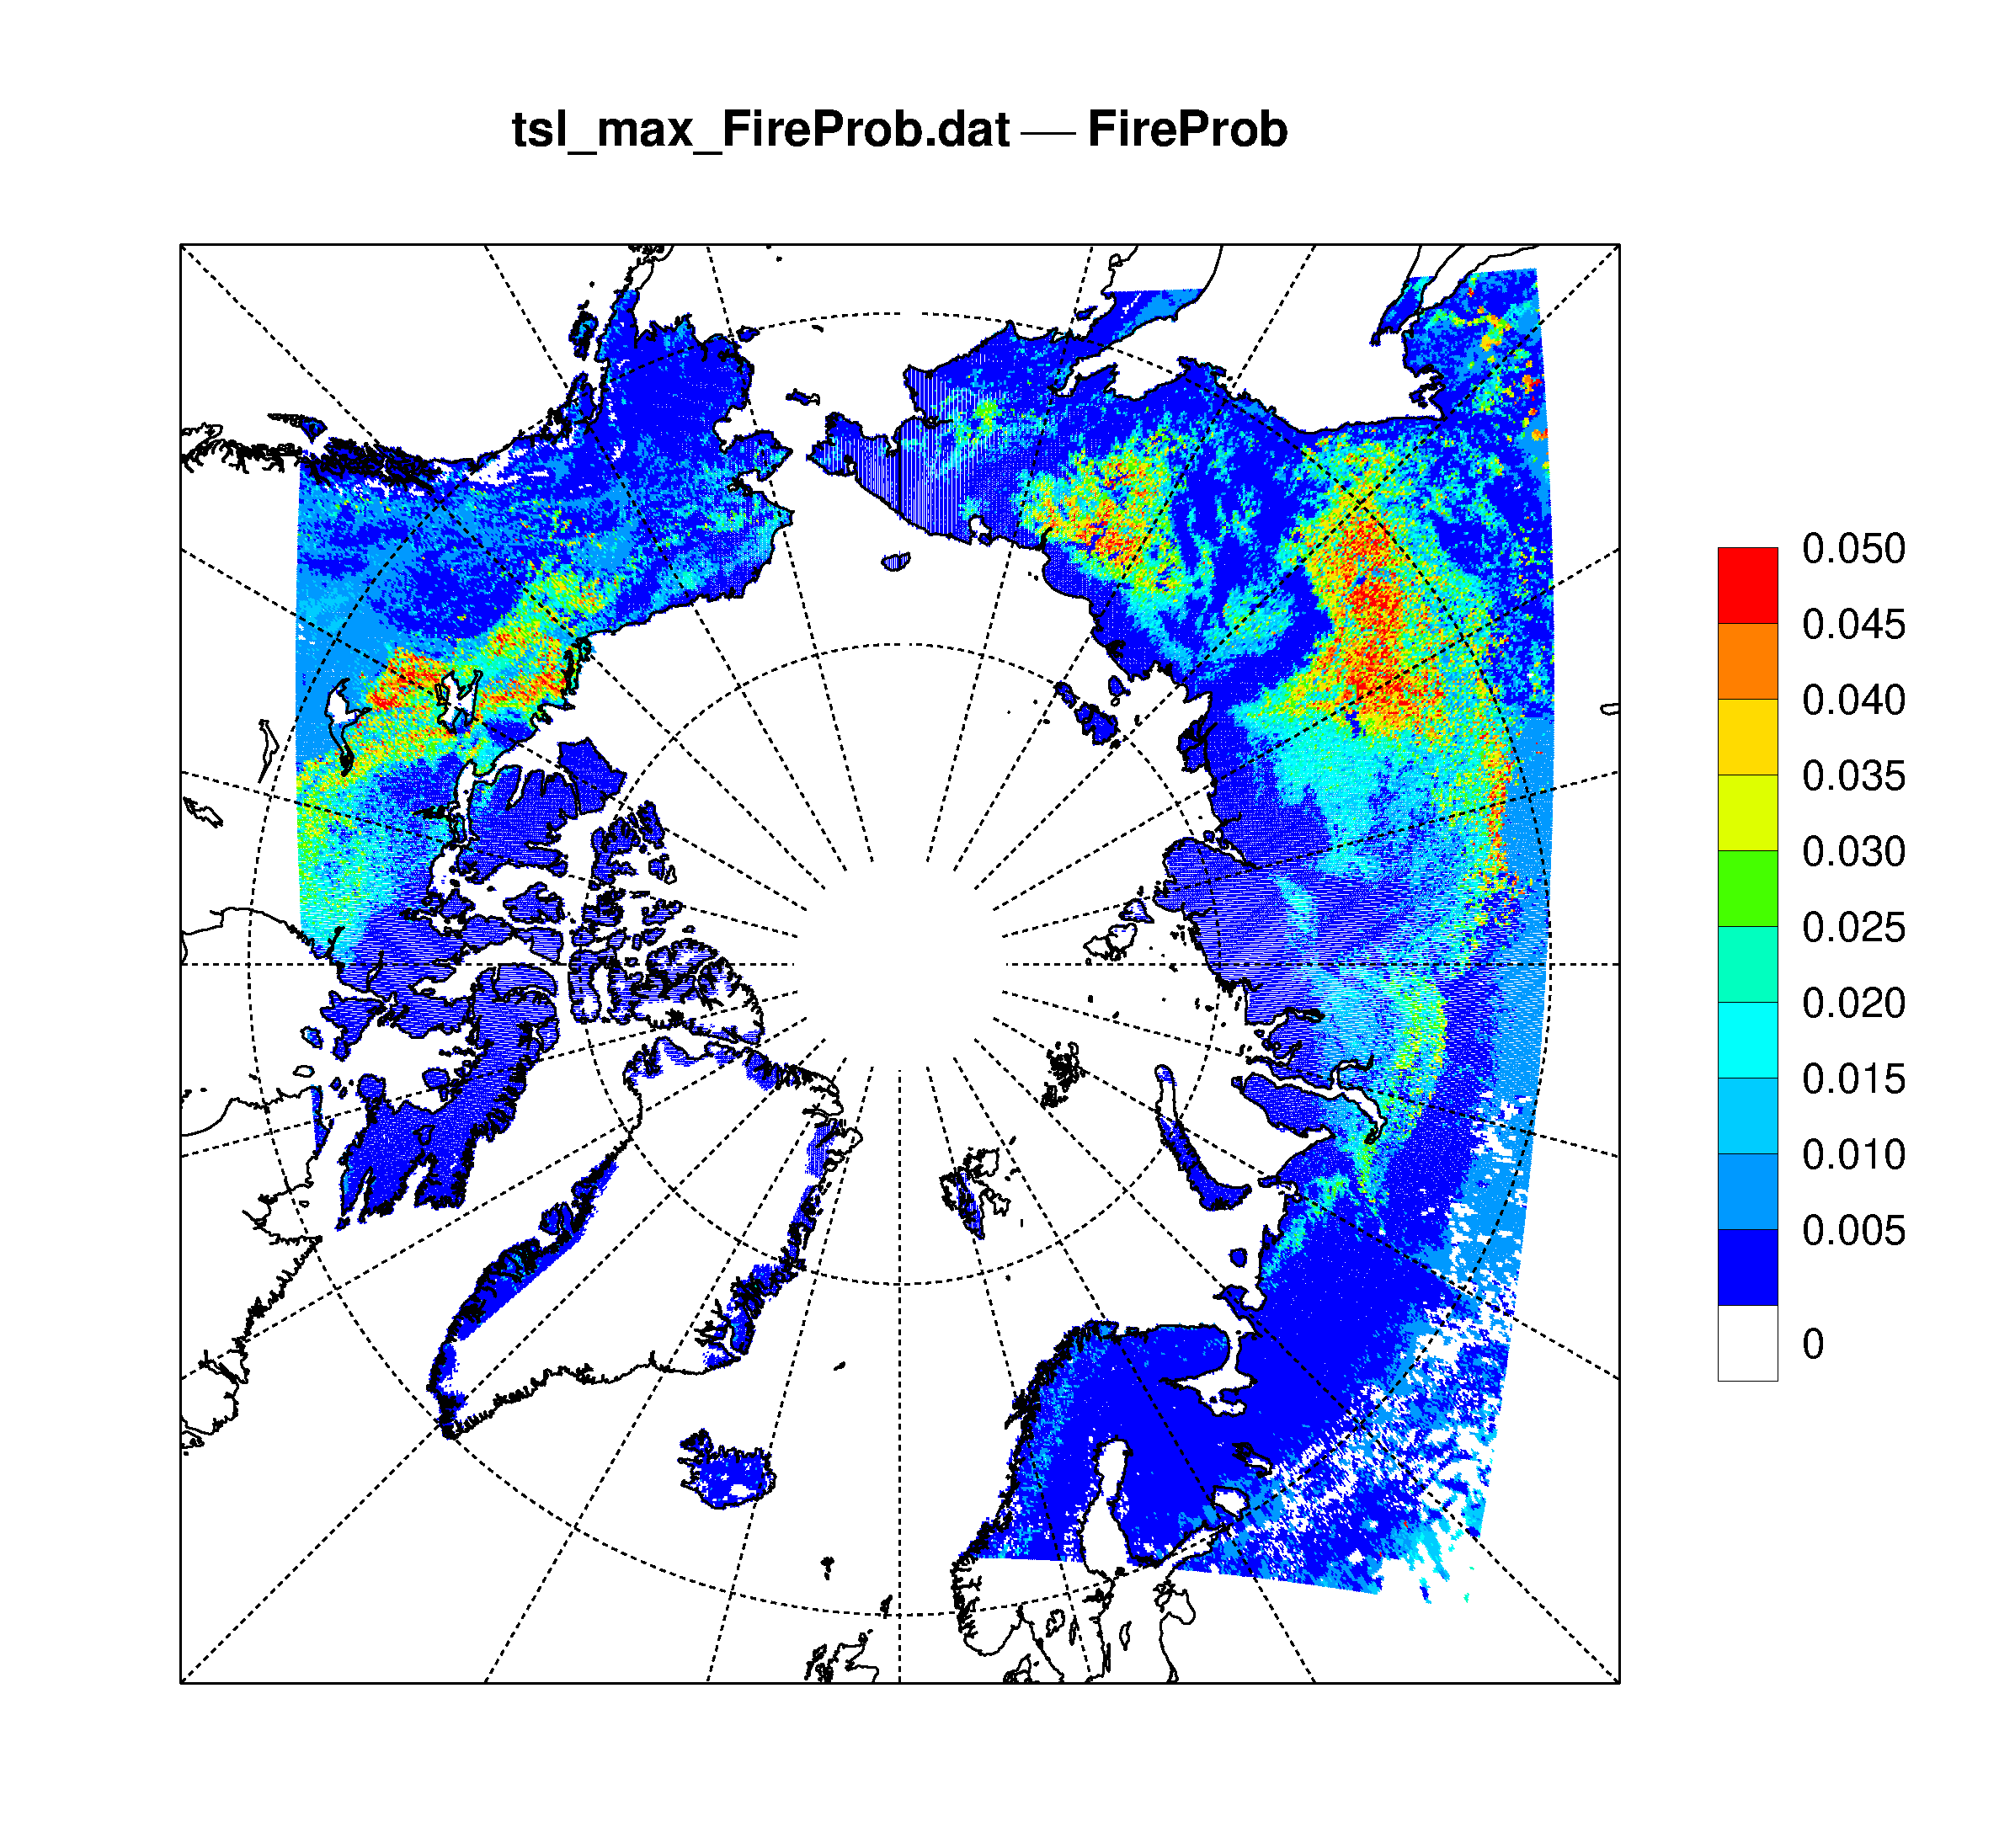
Projected maximum fire probability (2070–2100)
This map presents the projected maximum fire probability from two climate simulations, ICON-NorESM and ICON-CNRM, averaged over the period 2070 to 2100.
The maximum values from both models have been combined to represent a worst-case scenario.
The units are relative, i.e. on average a red gridcell will burn by about 5% every year, meaning it would completely burn approximately once every 20 years.
Reference map on the first slide.
For more information on editing stories, see this blog post.
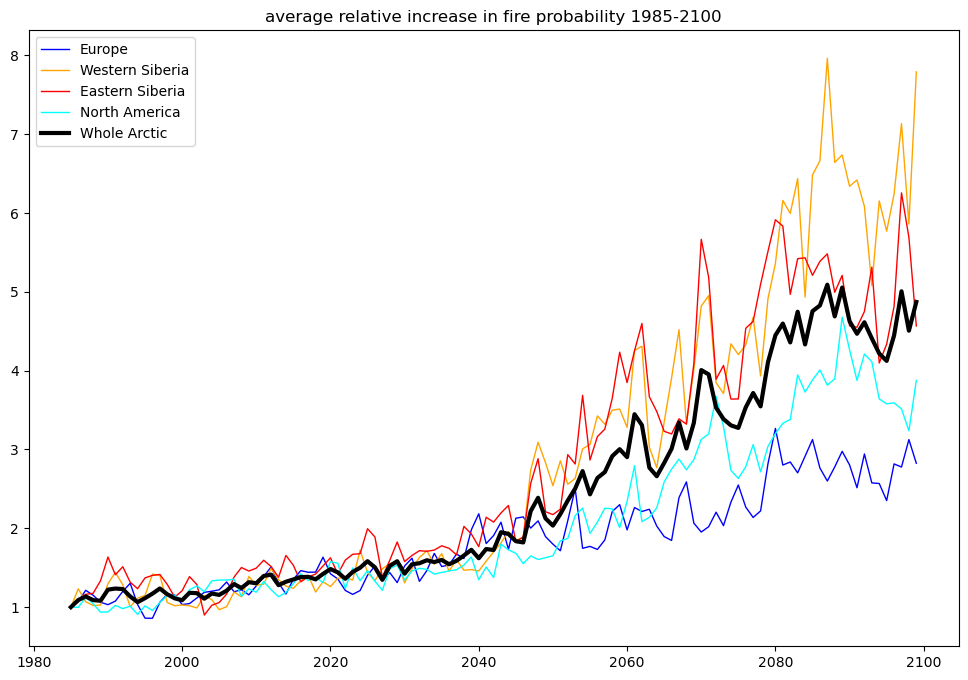
Relative increase in fire probability by region
This graph illustrates the relative increase in fire probability across four selected regions, as well as the average for the entire Arctic domain.
The data indicate that by 2100, the probability of fires to occur is expected to increase by a factor of 2.5 in Europe and by more than a factor of 6 in Western Siberia compared to 1985 levels.
For more information on editing stories, see this blog post.
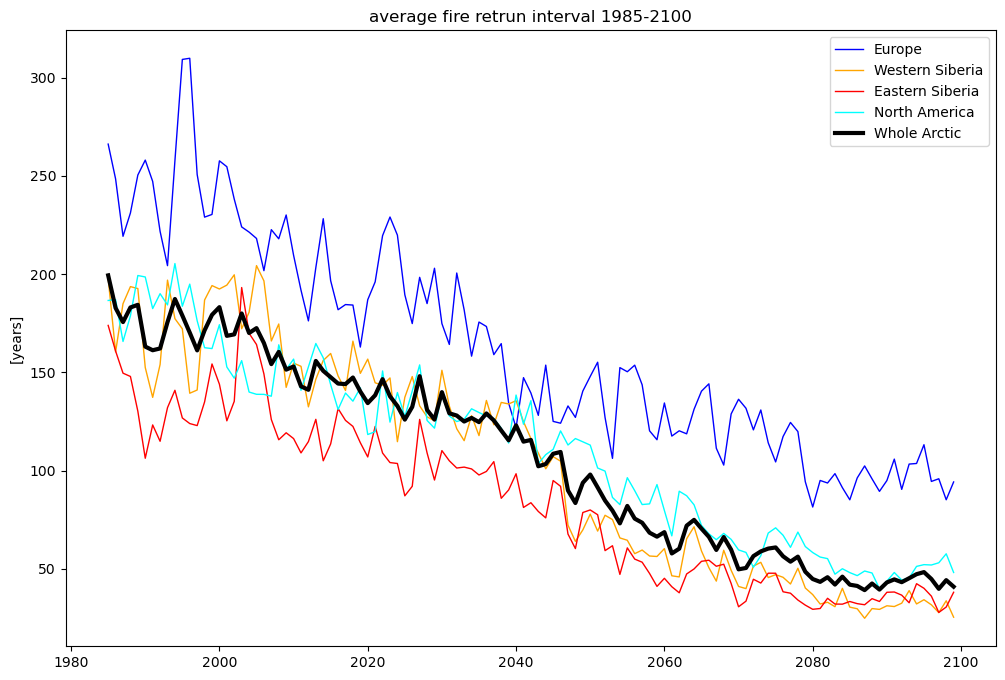
Shifts in fire-return intervals
The graph displays the same information as the previous slide but now turned into units of fire-return intervat, which answers the question: how long, on average, will it take for a location to burn twice? (Or, technically, for a grid cell to burn completely.)
Clearly, if your spruce plantation takes around 60 years from seeding to harvest, it makes a difference wheter you are likely to experience a fire during that time, as most areas now suggest (except Europe), or had nearly a two-in-three chance of avoiding it, as in 1985.
For more information on editing stories, see this blog post.
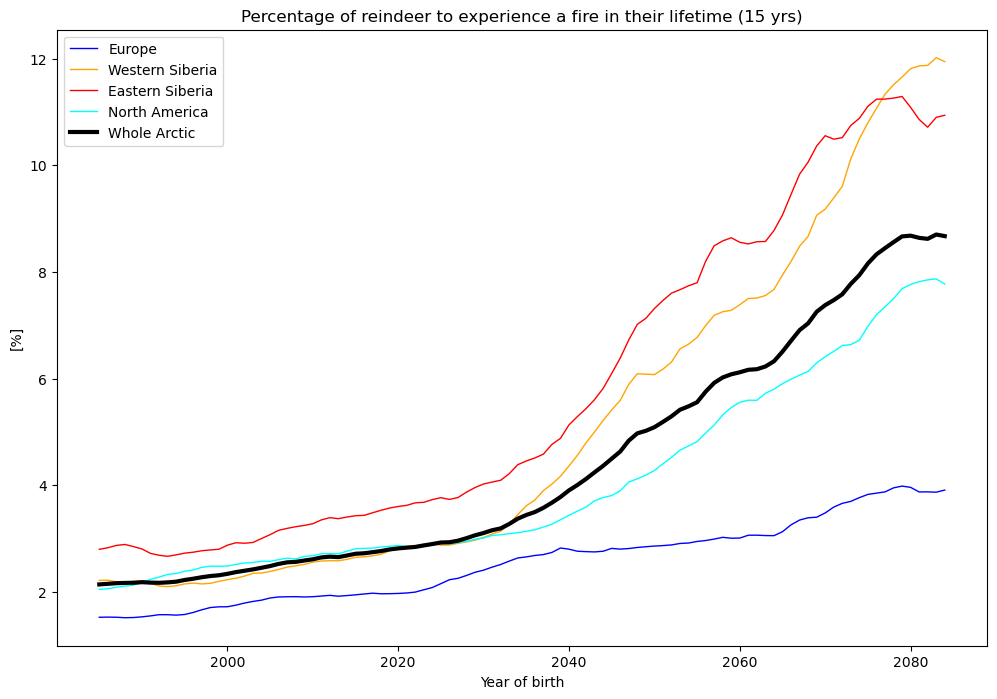
Reindeer and caribou fire Exposure
And finally the reindeers.
Although the visual data here may not appear striking, the implications are notable. Even with substantial climate-driven change, fires will remain relatively rare in these Arctic regions compared to other parts of the world.
However, the graph shows the percentage of reindeer (or caribou) that will statistically experience a fire within their average 15-year lifespan.
I do not know how much this actually affects the animals, but it is one way to express it statistically :)
For more information on editing stories, see this blog post.