Storyboard: The EUCP Caribbean runs
Caribbean
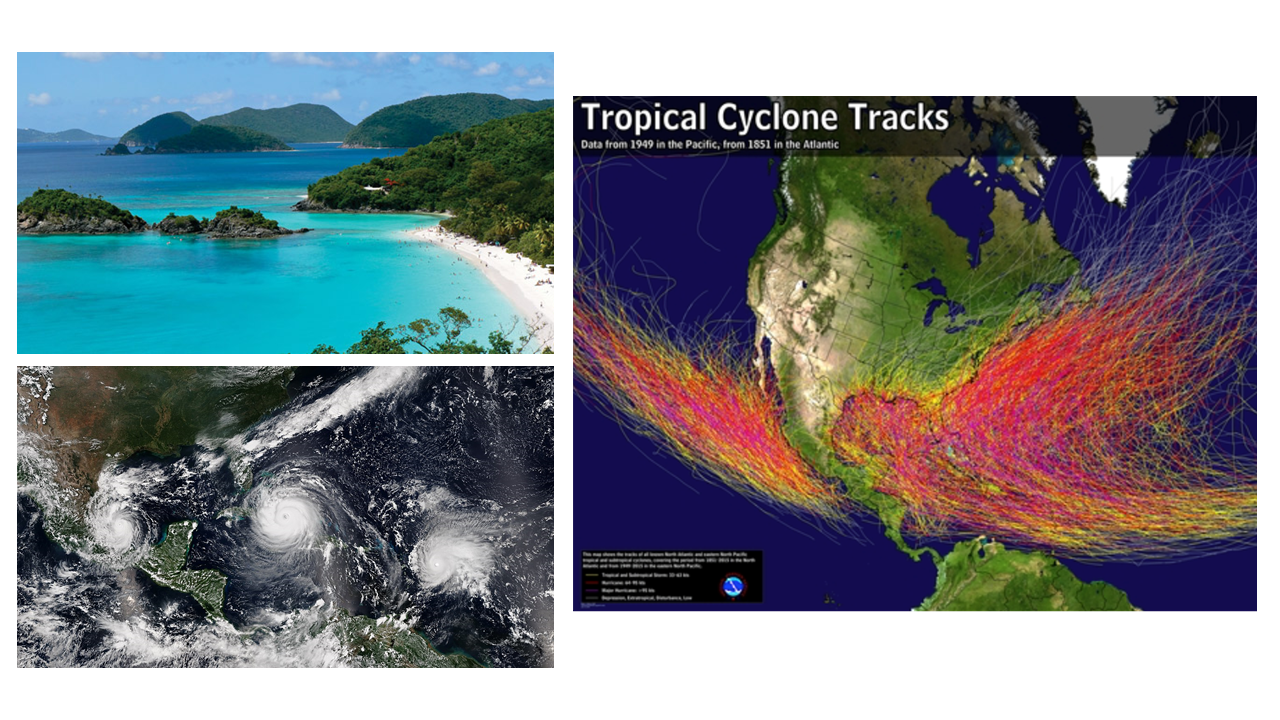
The European regional-climate simulations form the heart of EUCP WP3. On explicit request by the EU, EUCP conducted additional simulations for three "outer-European" domains. One of these is the Caribbean, known for its sunshine and sandy beaches, but also for devastating tropical cyclones, monster waves and coastal erosion. The two other domains are "Madeira and Canary Islands", and "La Réunion". The latter two are not discussed in this presentation.
Convection-Permitting (CP) simulations
Tropical cyclones (TCs) are the main hazard in the region. Resolving TC in a climate model requires high spatial resolution. The research question is to investigate climate change in the region with a special interest in the wind and precipitation characteristics of TC.
For more information on editing stories, see this blog post.

Existing literature
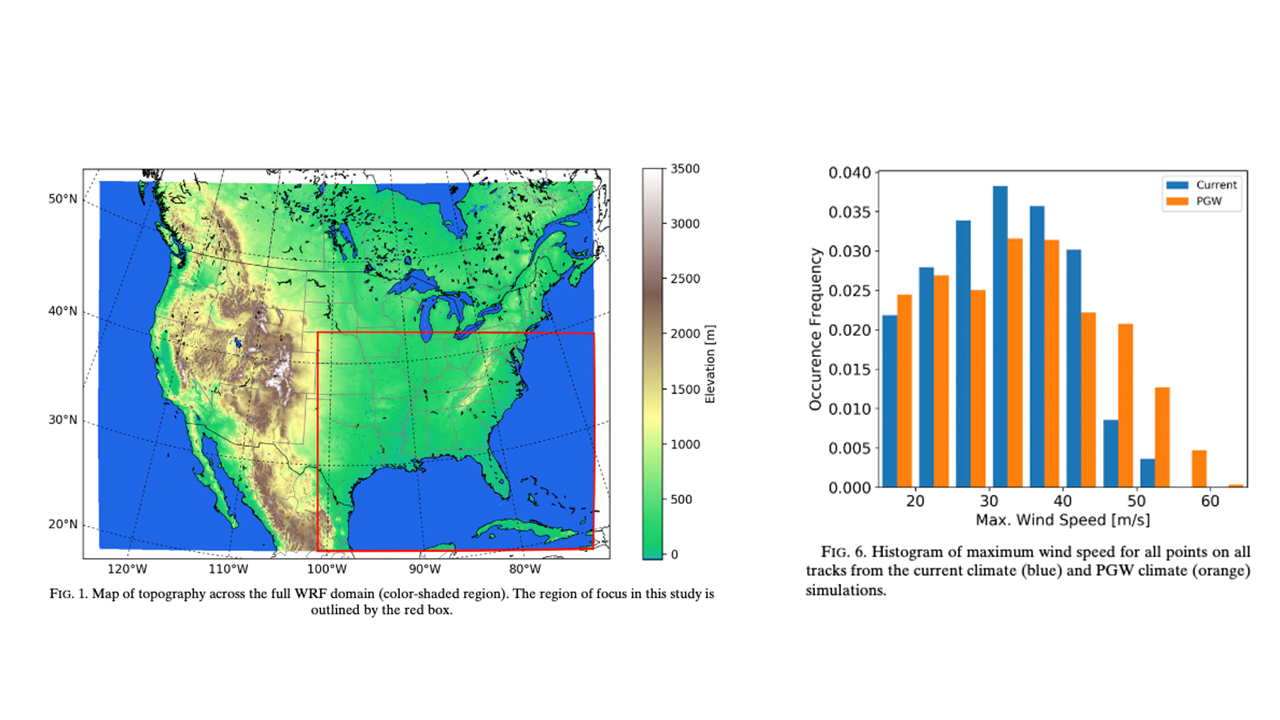
Existing literature on the subject (CPM simulations of the domain) is not very abundant yet. The paper by Gutmann et al (2018) found that a PGW approach gave satisfying results, with TC having faster maximum winds, slower storm translation, lower central pressures and higher precipitation rates. An important remark was that despite the PGW approach, there was surprisingly large variability between the storms, necessitating the creation of a large ensemble.
Gutmann et al. (2018): Changes in Hurricanes from a 13-Yr Convection-Permitting Pseudo-Global Warming Simulation
- ERA-Interim. Period 2001-2013 (32 storms).
- PGW: Changes from CMIP5
- CPM: WRF@4km. 5440 km (east-west) x 4064km (north-south)
Key results: on average faster maximum winds, slower storm translation speeds, lower central pressures, higher precipitation rates.
Important remark: changes varied substantially between individual storms, and not all storms were simulated in both simulations!
For more information on editing stories, see this blog post.

Contributing groups/models
Several groups signed up to contribute with CPM (and RCM) simulations.
CPM
- KNMI - HCLIM38-AROME (nested in RACMO)
- SMHI - HCLIM38-AROME (direct)
- ICTP - RegCM4-7 (direct)
- GERICS - REMO-NH (direct)
RCM
- KNMI - RACMO (1979-2020)
- DMI - HCLIM38-AROME 12km(!)
Simulation strategy
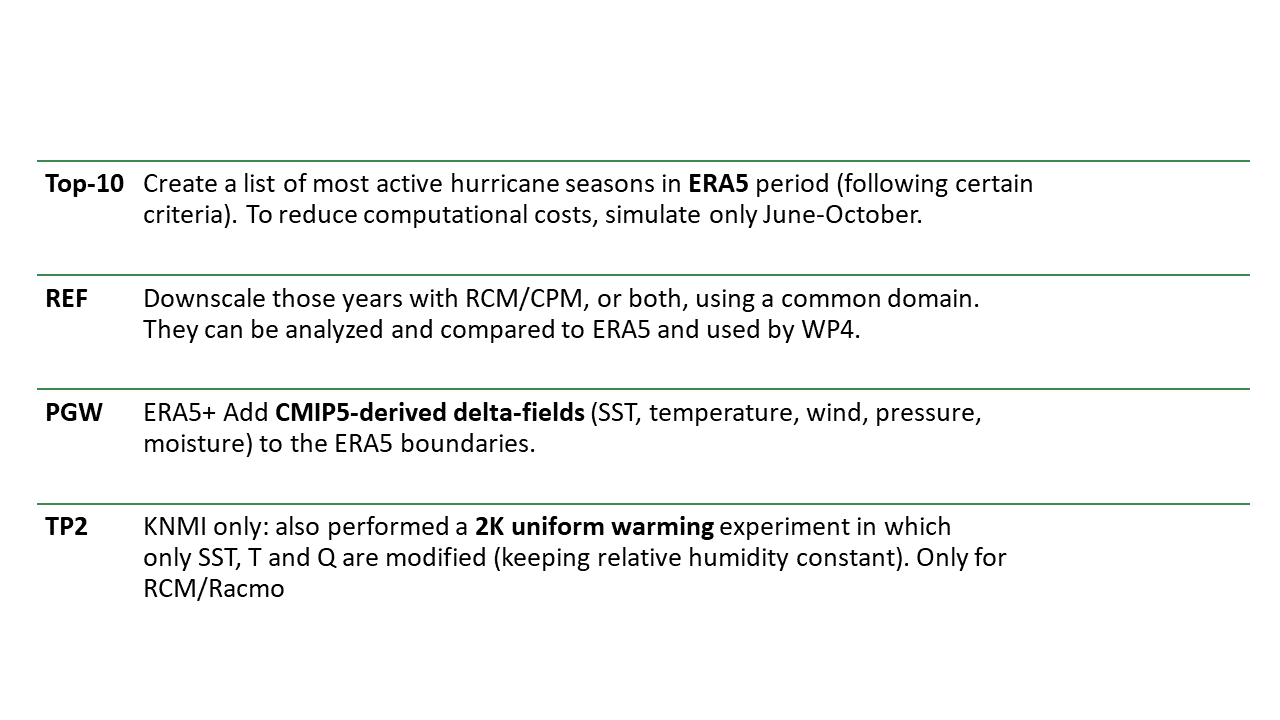
Simulation strategy was to come up with a top-10 list of hurricane seasons and simulate these using ERA5 as boundary and initial conditions (REF). A second set of simulations (PGW) was then created, by adding CMIP5-derived delta fields to the ERA5 boundary conditions. In this way, entire seasons were 'futurized'.
Note that within the domain, the models generate their own internal dynamics so it is not guaranteed that each REF and PGW run gives the same number of tropical cyclones. KNMI ran a third set of simulations using a uniform temperature increase.
For more information on editing stories, see this blog post.

Top-10 list
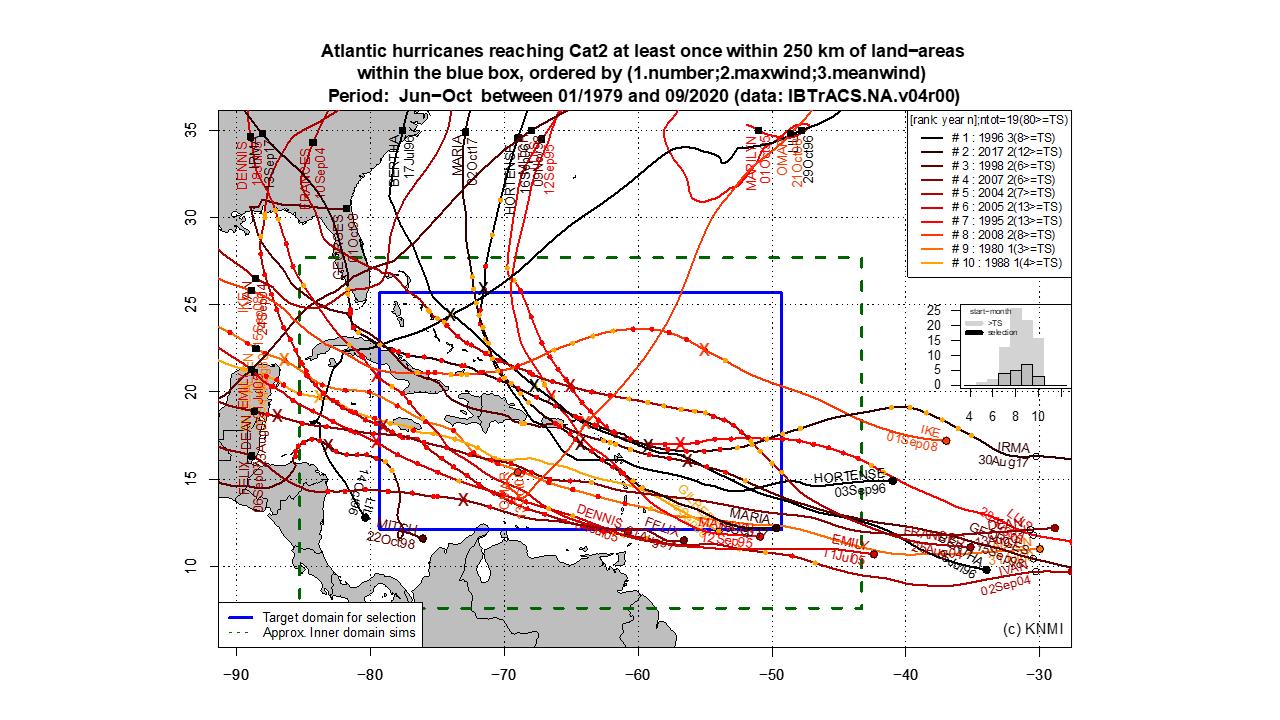
The top-10 list of seasons was created on the basis of the IBTrACS database and a couple of criteria (see the title of the plot). The approximate internal domain is shown, as well as the named hurricanes occurring in the top-10 seasons.
For more information on editing stories, see this blog post.

First results
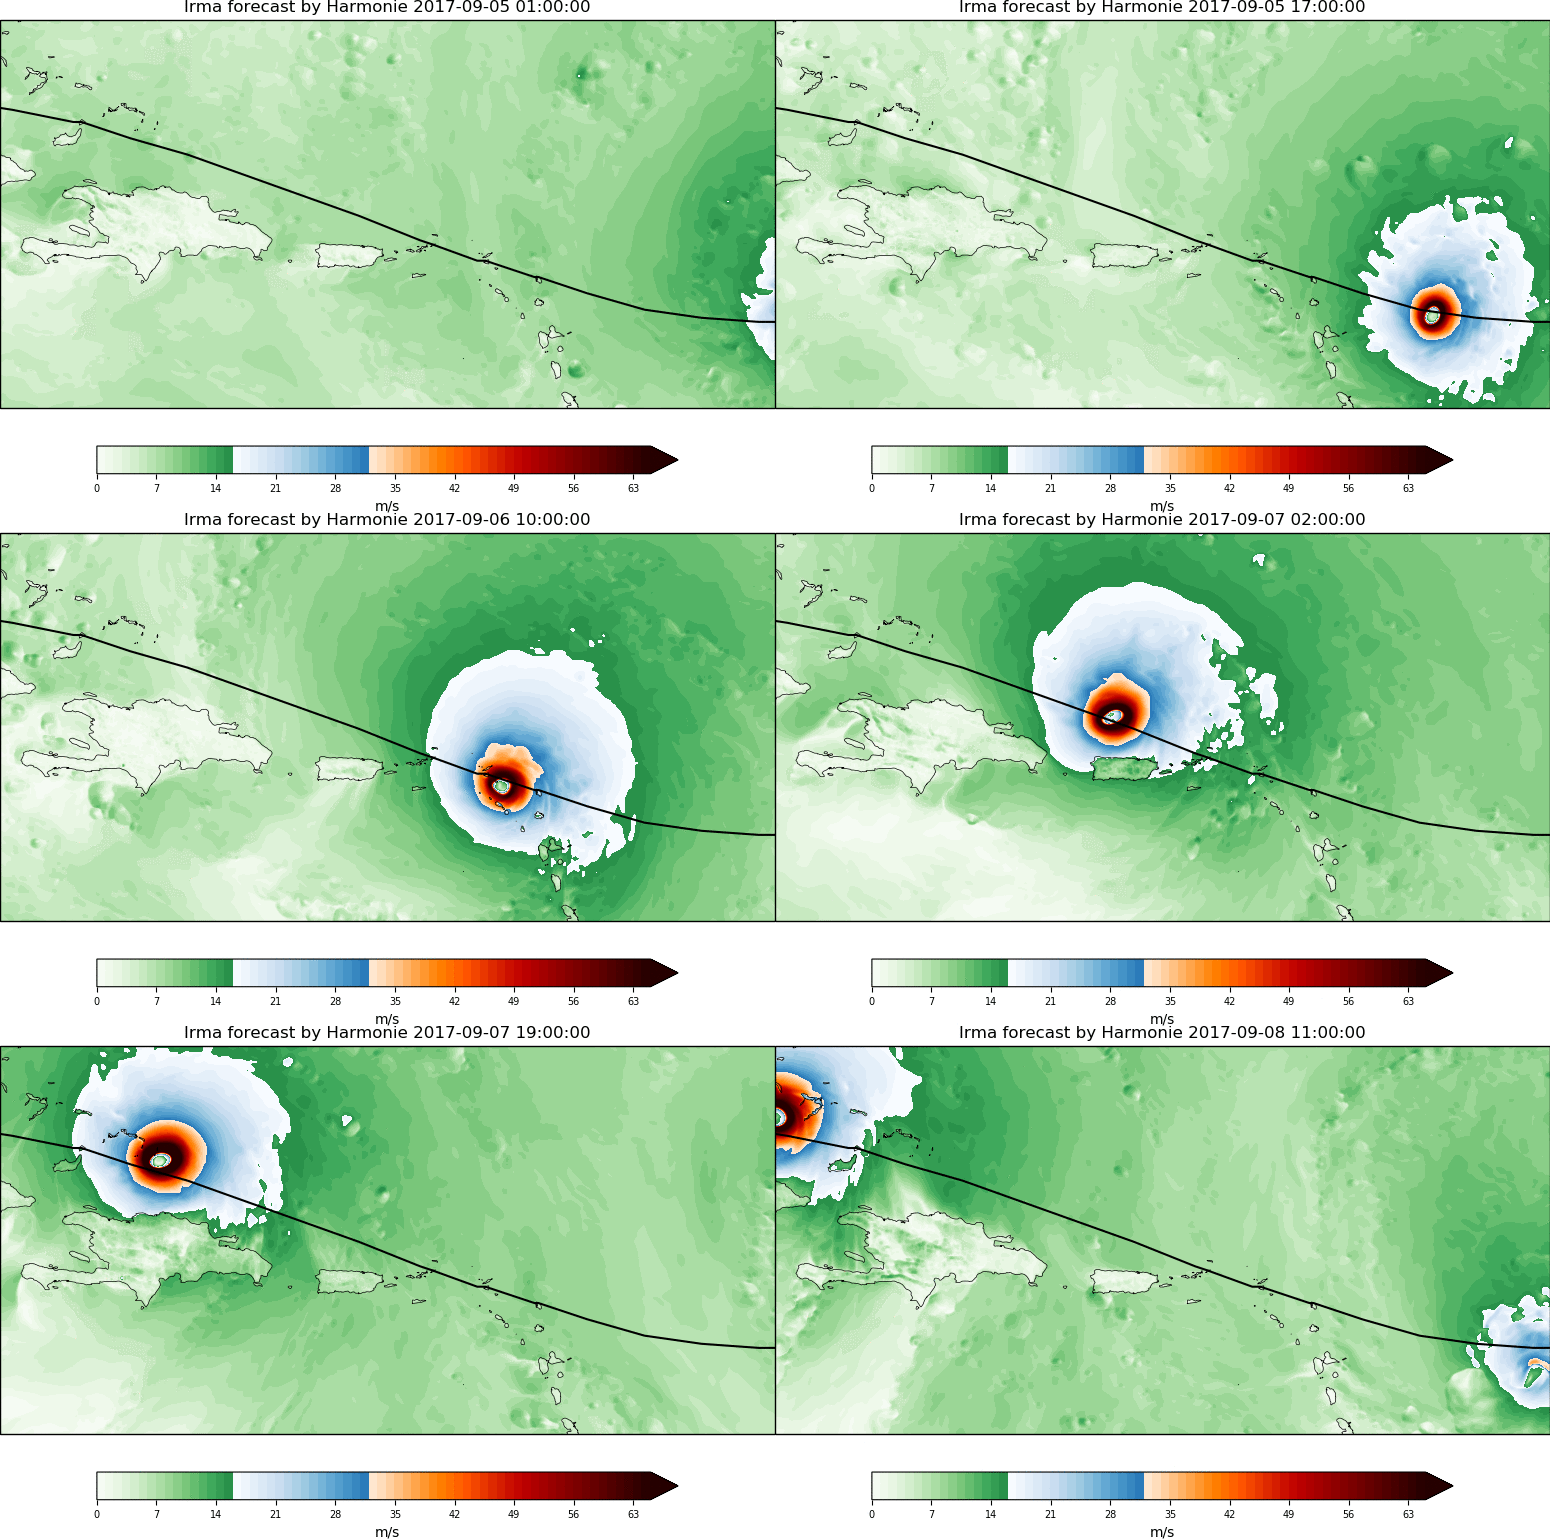
Shown is the simulation of the hourly windfield. The black line is the observed track from the IBTrACS database. The TC is well resolved (eye formation) and follows the observed track rather accurately, making it suitable for impact studies in e.g. WP4. At the end of the simulation period, the next tropical cyclone (Jose) is just appearing.
For more information on editing stories, see this blog post.

Poor man's tracking
As a second example we count the number of hours with hurricane-force windspeeds in each of the models in the 2017 hurricane season. This could be considered as a poor man's tracking approach. Although most models resolve the TC from 2017, there is still some model spread (remember the lateral forcing is all identical).
Note that the models labelled SMHI and KNMI are identical (HCLIM-AROME), but that KNMI uses RACMO as the intermediate model, whereas SMHI uses a direct approach. SMHI and DMI are also the same model, but their resolutions differ. Track coherence seems weakest in GERICS (REMO-NH model).
For more information on editing stories, see this blog post.
Poor man's tracking with PGW perturbations added
In the second experiment, the same seasons were simulated with PGW perturbations added. Again we see considerable differences, although some of the major hurricanes still feature on the map. But clearly it is not guaranteed that each TC get more intense under PGW. To the contrary, most of the TC shown here seem to weaken (except in the simulations by GERICS (REMO-NH). Also the tracks are not identical, implying that studying impact changes is not straightforward, unless we aggregate / pool results. A similar pattern is shown when we use all years. Many storms weaken, some seem to intensify, and most display small changes in track location.
For more information on editing stories, see this blog post.
Precipitation (Reference runs)
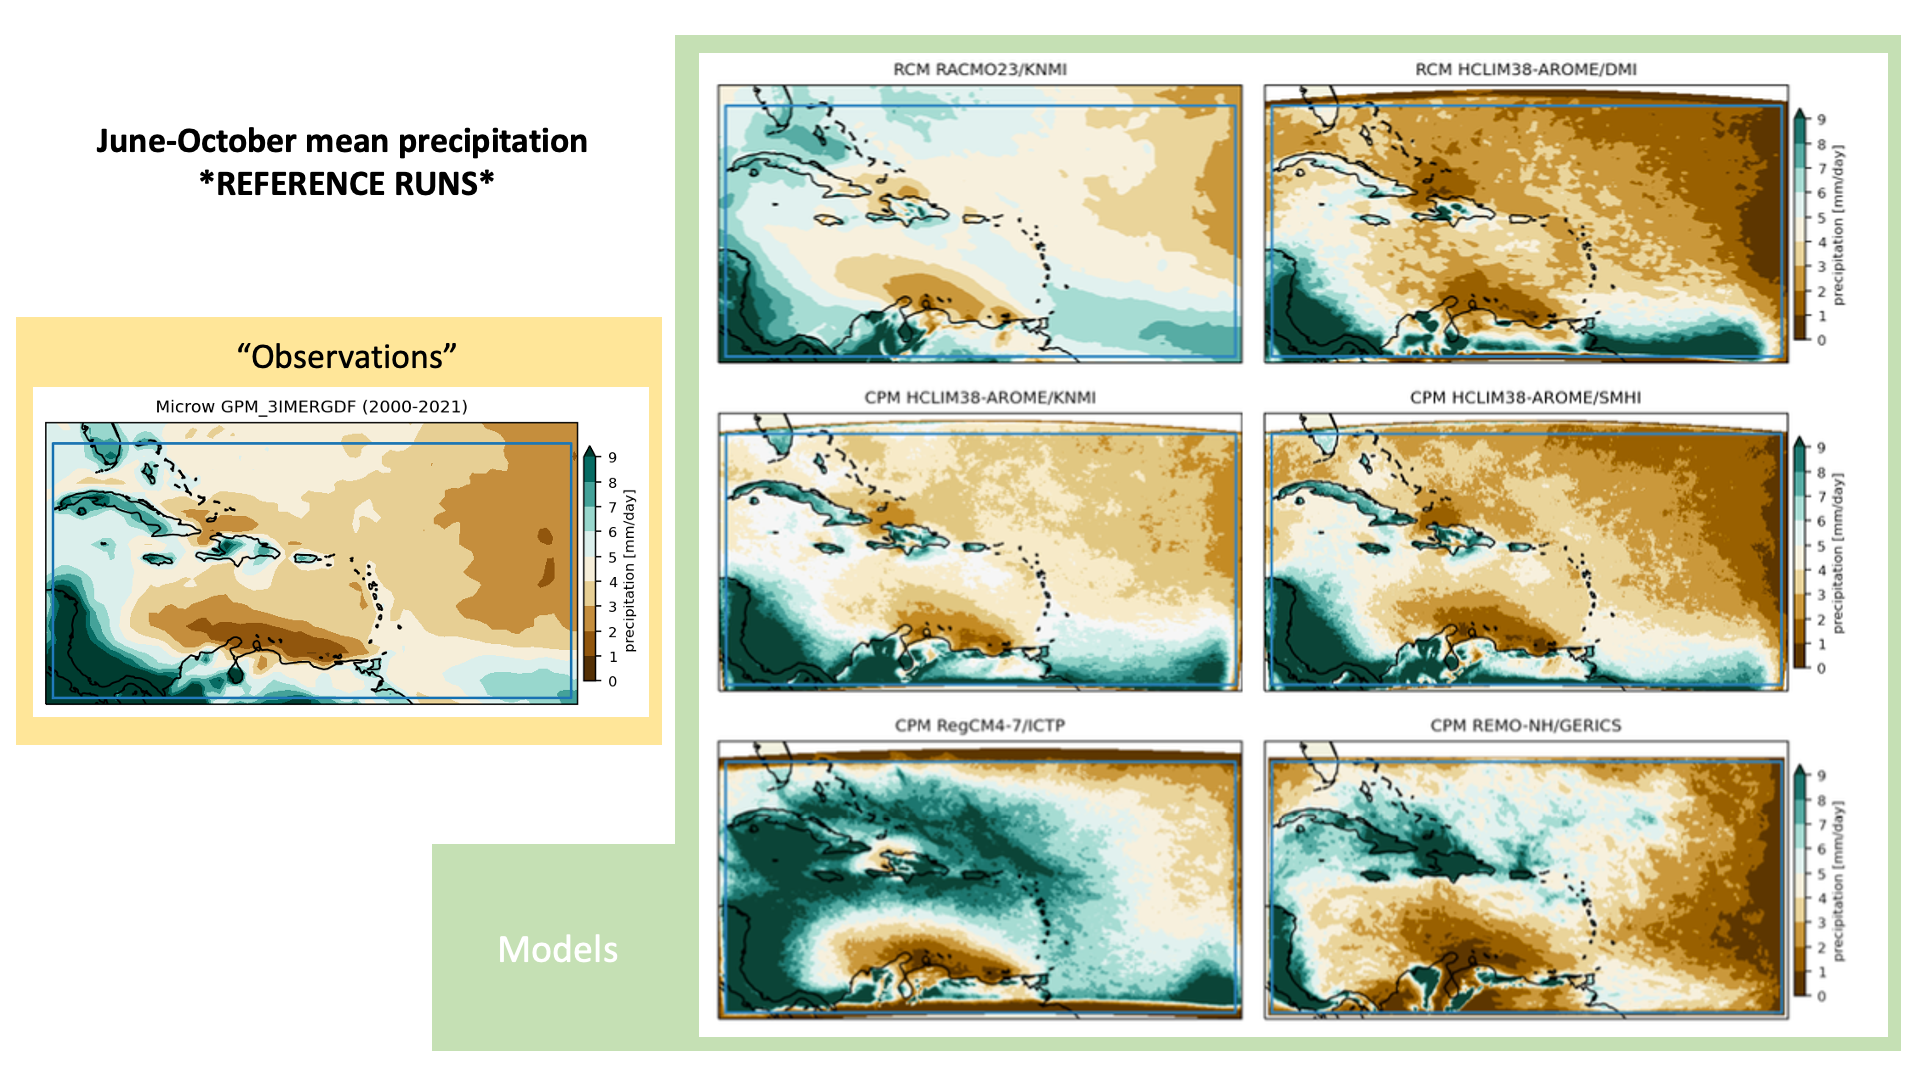
There are large contrasts in precipitation amounts over the domain. The observational estimate shows this clearly. The models are able to reproduce this pattern, but there is substantial inter model spread. The models tend to be dry-biased in the east. Especially RegCM4-7 and REMO-NH are very wet in the south-west of the domain.
For more information on editing stories, see this blog post.

Precipitation change
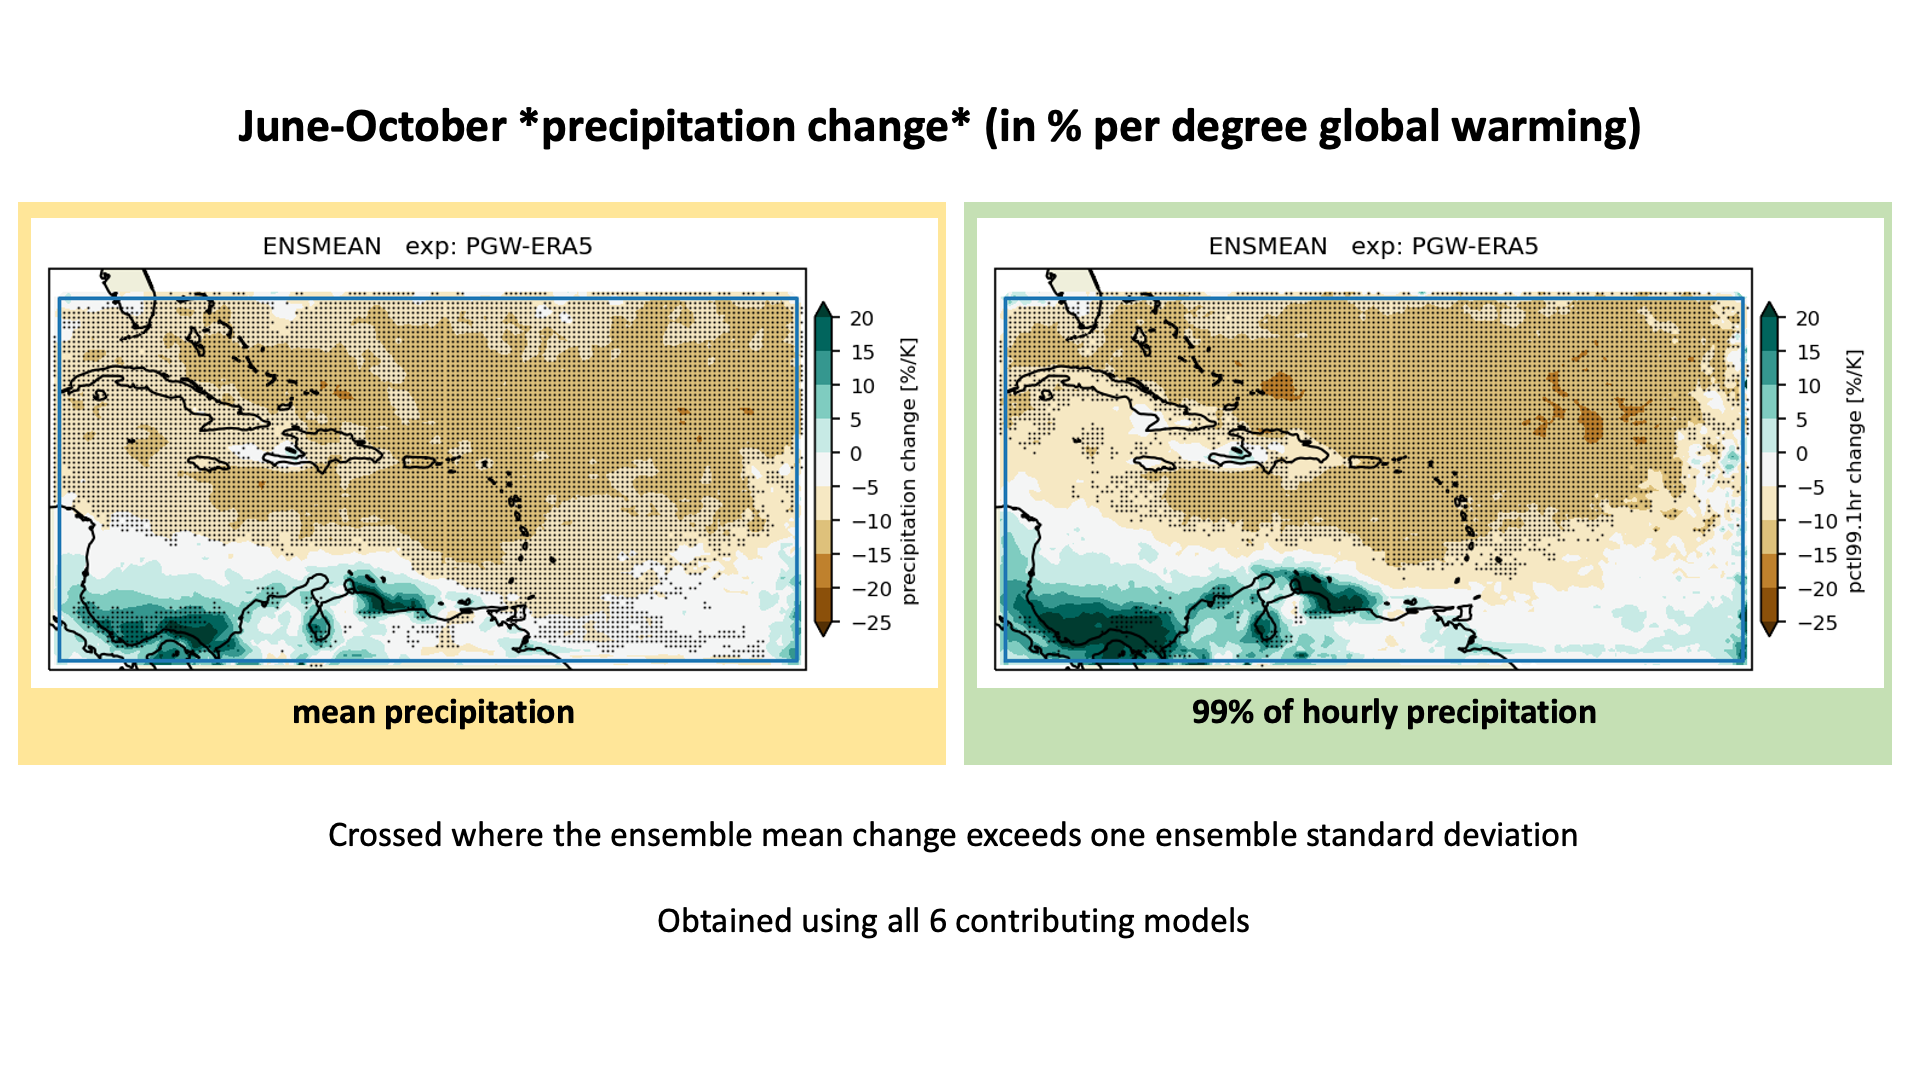
The 6-member ensemble is analysed for the future precipitation changes, computed as the relative difference between the PGW and REF runs. Ensemble-mean changes of mean precipitation (left panel) and the soft extremes (99% of hourly values, right panel) are shown. Both feature a robust drying over most of the domain, with increases in the south of the domain. It is expected that part of this drying is due changes in the large-scale forcing.
For more information on editing stories, see this blog post.

Precipitation
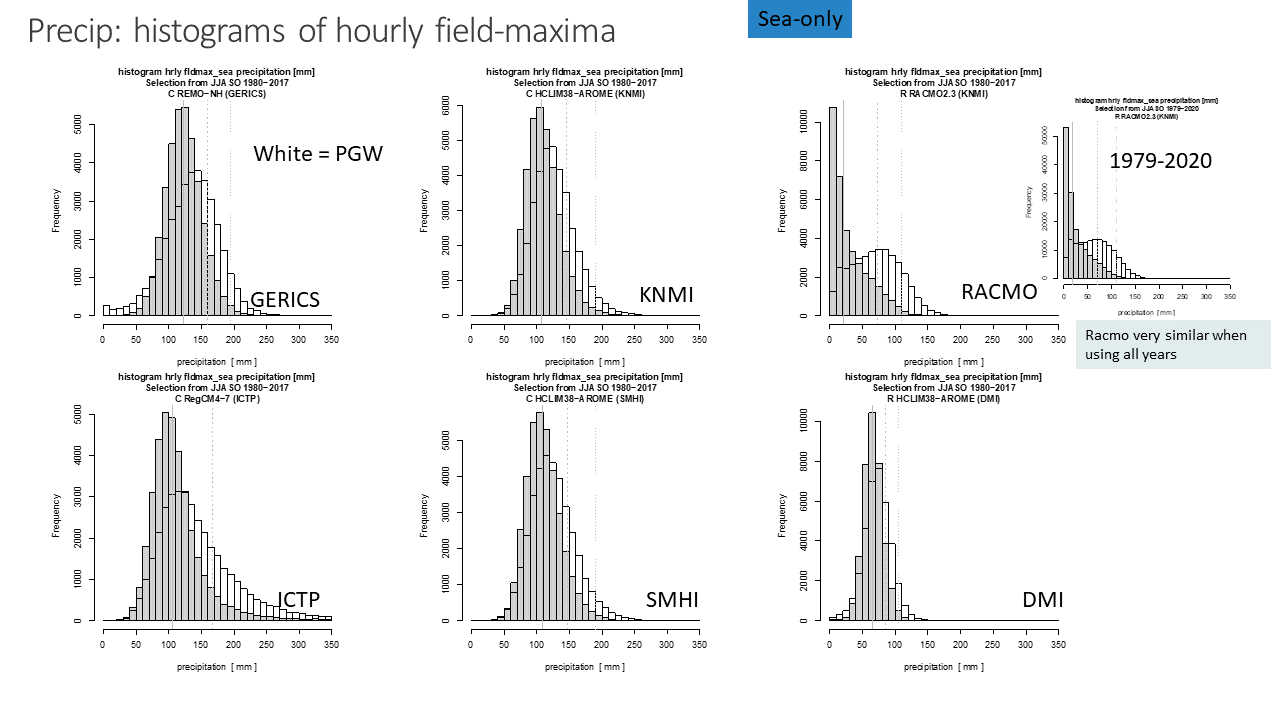
Finally we look at the changes in the hourly spatial maximum of the precipitation field (sea areas only), aggregated over all hours and all years. By looking at the field-maximum information on the size and location of events is discarded.
There are substantial differences between the models, yet all show unmistakably a tendency towards higher maxima in future. A more complete analysis of the distribution, that includes the size of events is in preparation.
For more information on editing stories, see this blog post.

Summary and conclusions
EUCP Caribbean CPM and RCM simulations:
- ERA5 + PGW, June-October (hurricanes).
- Ten seasons were selected based on historic hurricane activity.
- Data is used by WP4 for storm-surge modelling.
Preliminary results:
- The CPMs and RCMs are able to properly describe evolution of tropical cyclones. However, even in the current climate (using ERA5 forcing) there is substantial spread between models.
- A poor man’s tracking shows that not all tropical cyclones are reproduced in REF and PGW: Optimal conditions in present-day climate not necessarily more favorable for development in the future climate.
- Average precipitation and soft hourly extremes (99%) decrease over most of the domain (large model spread), except over the land areas in the south. There is however substantial model spread.
- The distribution of hourly precipitation field maxima over sea show clear increases.
To do:
- More extended analysis, including pooling of results.
- A paper is in preparation.
Reference
For more information on editing stories, see this blog post.


